Financial framework
Shell’s strategy and financial framework are designed to manage through multi-year macro price-cycles and multi-decade investment and returns programmes. We balance near-term affordability and cost trends with the fundamentally long-term nature of our industry.
The balance sheet must support dividends and re-investment through the low points in oil market cycles. Our intention is to generate sufficient free cash flow at the lower end of the price cycle to cover the cash dividend.
Cash flow priorities 2016–18
for cash
reduction
Our priorities for cash flow are reducing debt and paying dividends, followed by a balance of capital investment and share buybacks.
Shell’s dividend distributed in 2015 was $12 billion. Our dividend policy is to grow the US dollar dividend through time, in line with our view of Shell’s underlying earnings and cash flow. When setting the dividend, the Board looks at a range of factors, including the macro environment, the current balance sheet and future investment plans.
We see potential for at least $25 billion of buybacks in the period 2017 to 2020, subject to debt reduction and some recovery in oil prices.
Four financial levers
investment
operating costs
projects
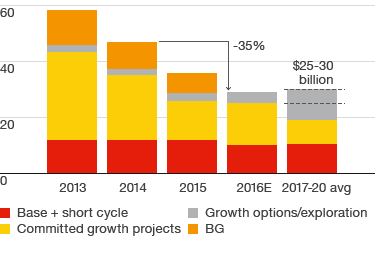
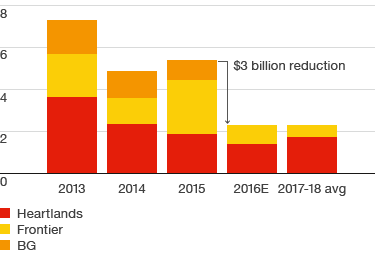
Capital investment
$ billion; excludes BG acquisition in 2016

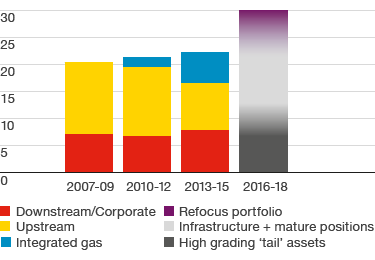
Divestments program
$ billion

Exploration expenditure
$ billion

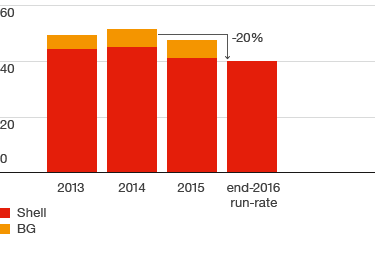
Operating cost
$ billion