Safety performance
Our safety performance in 2015 was mixed, as described below.
Personal safety
In 2015, following steady and significant improvements in our safety performance over the past decade, we achieved our lowest ever number of injuries per million working hours – the total recordable case frequency (TRCF). We also achieved our lowest ever level of injuries that led to time off work in 2015, measured as lost time injury frequency (LTIF).
Sadly, seven people lost their lives while working for Shell in 2015; four of them during one single operational incident. Our fatal accident rate (FAR) – the number of fatalities per 100 million hours worked – increased in 2015 after many years of significant improvement. We investigate and learn from these incidents – along with any significant near misses – to reduce the risk of harm.
Process safety
A process safety incident is any leak or spill of hazardous material. In line with industry standards, we measure and report according to the significance of the incidents, with Tier 1 as the most significant. In 2015, we achieved our lowest ever total for both Tier 1 and 2 operational process safety events: 51 Tier 1 occurrences in 2015 (57 in 2014) and 169 Tier 2 in 2015 (194 in 2014).
Process safety events that are related to sabotage and theft in Nigeria are recorded separately. There was an improvement during 2015 with fewer incidents: 28 Tier 1 and 17 Tier 2 events (91 Tier 1 and 48 Tier 2 in 2014).
In 2015, the six most significant operational incidents were:
- four fatalities during a pipeline repair (Nigeria);
- a gas release from the Curlew offshore production facility (UK);
- a crude oil spill from an onshore well (Nigeria);
- a fire at a furnace at the Rhineland refinery (Germany);
- a fire at the Bukom refinery (Singapore); and
- a gas release from a subsea reinjection pipeline (UK).
Safety in the community
The Groningen gas field in the Netherlands is operated by Nederlandse Aardolie Maatschappij B.V. (NAM, Shell interest 50%) and is one of the largest onshore gas fields in Europe. Earthquakes occur in the province of Groningen as a result of gas production. Following the Huizinge earthquake in August 2012, new insights emerged about the potential intensity of future earthquakes. NAM is in discussions with the local communities about their concerns regarding safety and the uncertainties about the future.
An extensive study is in progress to better understand seismic risk in the area. Several international universities and researchers are involved, with the final report expected in 2016. Interim results from November 2015 include a seismic risk assessment which demonstrates that all production levels analysed meet the acceptable risk boundaries set by the Netherlands Ministry of Economic Affairs.
Since 2012, the ministry has set gas production reduction measures, including a production limit. A range of actions has been taken to improve safety, liveability and economic prospects in the region. NAM is working hard, together with all relevant parties, to fulfil commitments to the residents of the area. A long-term programme has been developed by the National Coordinator for Groningen to work with regional authorities and residents on issues such as improving the handling of claims and resolution of disputes. NAM is publicly sharing information on its progress and publishes earthquake measurements.
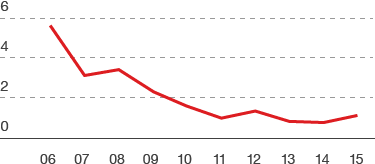
Fatal accident rate (FAR)
fatalities per 100 million working hours

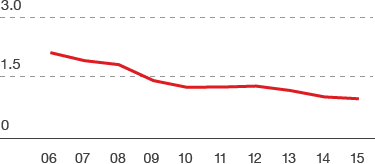
Lost time injury frequency (LTIF)
injuries per million working hours
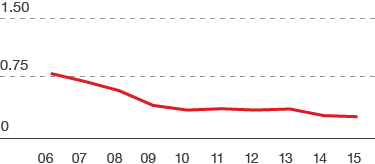

Total recordable case frequency (TRCF)
injuries per million working hours