Social performance
We have indicators in place that gauge our relationship with communities near our operations. We also measure our contribution to communities through our social investment programmes and the procurement of local goods and services within our supply chain.
Community feedback
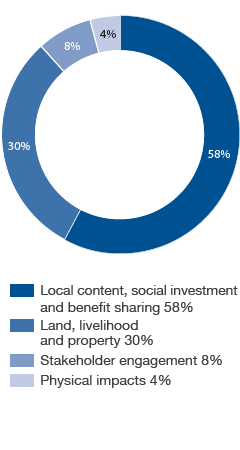
Shell uses data from our community feedback mechanisms as a performance indicator at both the local community and global levels. Community complaints are registered in different categories to identify common issues across Shell and share knowledge on how they were resolved. In 2015, the largest number of complaints received related to social and environmental issues. These included concerns about Shell’s allocation of its social investment funds, the creation of local jobs and the impact of our operations on people’s land, property or livelihoods. Most environmental complaints related to nuisances, such as noise, odours or dust.
Social investment
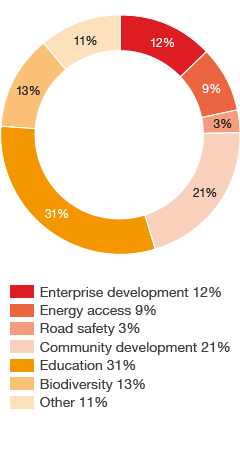
We invest in projects that aim to benefit local communities over the long term. In 2015, we completed our first assessment of the long-term impact of our social investment projects globally. In 2015, we spent around $122 million on voluntary social investments worldwide (compared with $160 million in 2014). Our social investment is closely connected to the locations where we operate and so portfolio changes can affect the amount that we spend. This is the main reason for the decrease in social investment in 2015. These figures do not include investments that were part of contractual agreements or legal requirements with host governments, which was around $97 million.
Of the $122 million, we spent around $29 million on our three global strategic themes of enterprise development, road safety and energy access. Around $93 million was spent on local programmes for community development, disaster relief, education, health and biodiversity. We estimate that almost $43 million of our spend in 2015 was in countries that are part of the UNDP Human Development Index 2015, that is, those defined as having a gross domestic product of less than $15,000 a year per person. Significant support is also provided in the form of voluntary work by Shell employees and donations of equipment.
Local procurement
We prioritise buying goods and services from local suppliers that meet the standards we require. In some cases, we support local businesses and skills development to meet these standards. In 2015, we spent more than $56.3 billion on goods and services worldwide. Around 65% of this was spent in Canada, the Netherlands, Nigeria, the UK and the USA. We estimate around $5.9 billion was spent in countries that have a gross domestic product of less than $15,000 a year per person. In these countries, Shell companies spent more than 75% ($4.4 billion) on goods and services from local companies.
We also check that our suppliers comply with key sustainability criteria, including good working conditions. In 2015, we conducted 10 assessments of suppliers in Africa and the Middle East, 126 in the Americas, 129 in the Asia-Pacific region, and 119 in Europe to check their compliance with our Shell Supplier Principles. These principles cover areas such as human rights, labour practices (including those relating to child and forced labour) and business integrity. (See Contractors and suppliers).
Voluntary social investment in 2015
proportion of spend

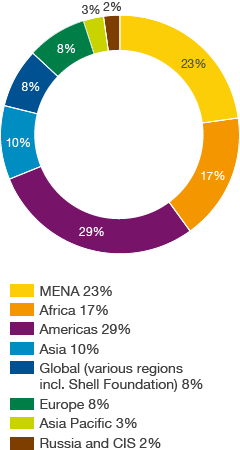
Voluntary social investment in 2015
split by region

Community complaints in 2015

View the pie charts above in table format