Reporting against aspirations
This table represents a selection of global metrics that we track within Shell. These metrics have been selected because they reflect the direct impact of our operations on people and the environment. We used them to set our goals and measure progress in 2016 and to define priorities for 2017.
We review the metrics we use regularly to ensure that we capture the information needed to improve our performance. For example, Shell introduced Goal Zero for personal safety in 2007. Since then, we have broadened the goal to aim for no harm to people and the environment. More information on our performance, definitions of the indicators and the referenced goals are provided in the Environmental data and Social and safety data sections.
Goals and performance for 2016 and priorities in 2017

Goals and performance for 2016 and priorities in 2017
Personal safety
Personal safety
2016 Goal
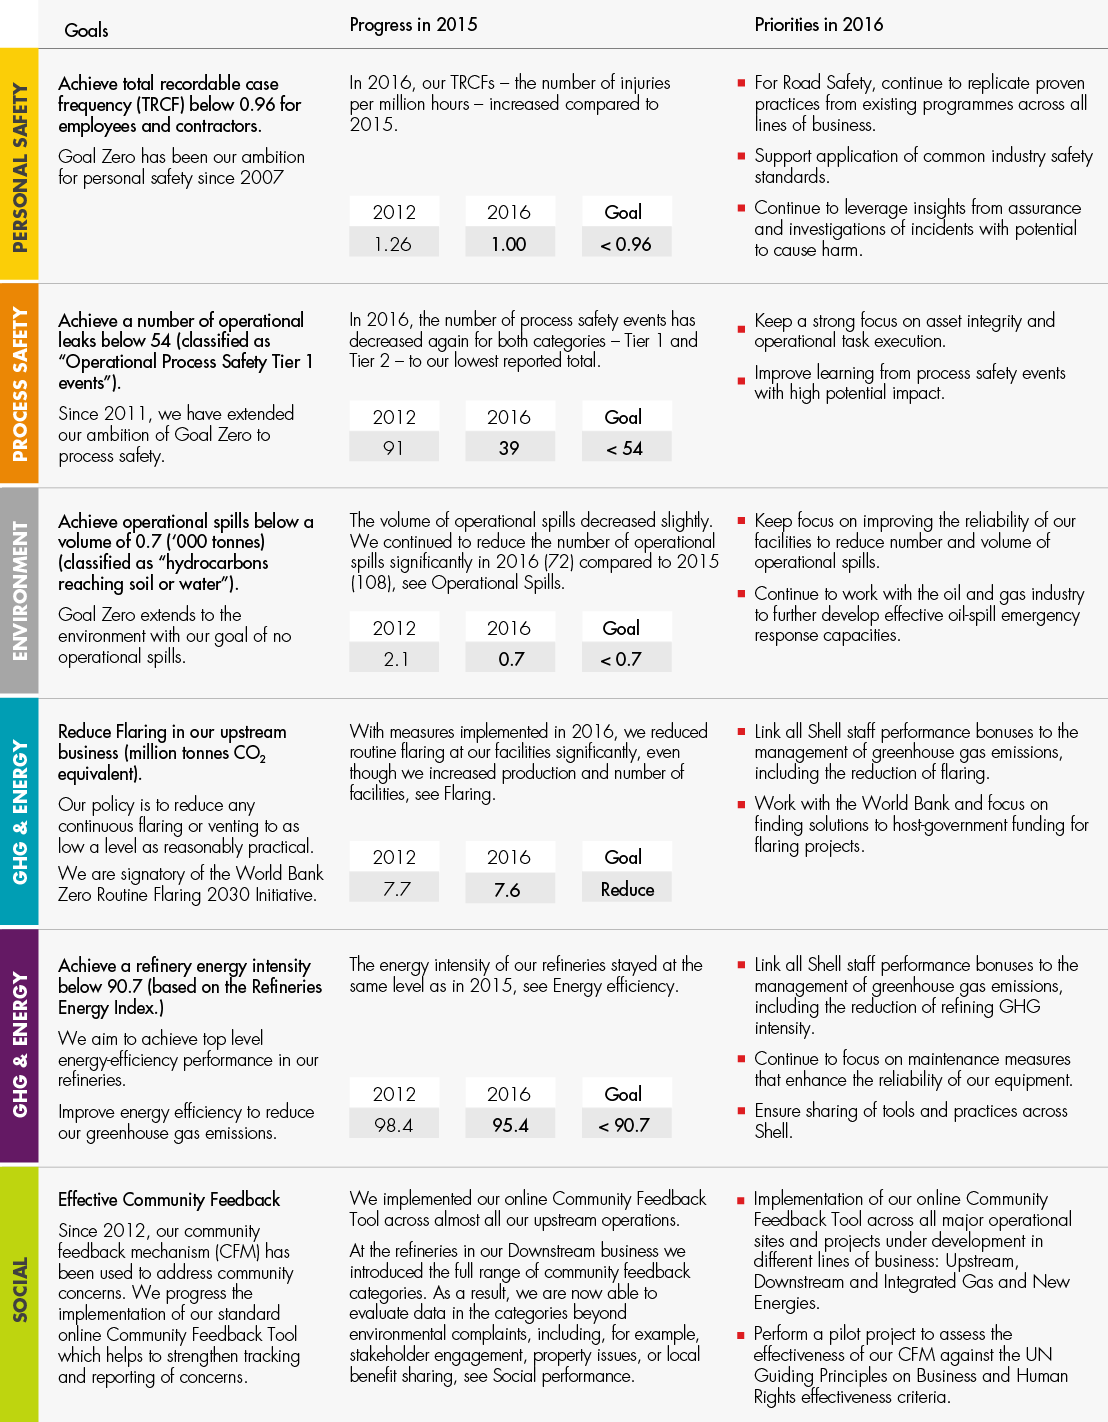
Achieve total recordable case frequency (TRCF) – the number of injuries per million working hours – below 0.96 for employees and contractors.
Goal Zero has been our ambition for personal safety since 2007
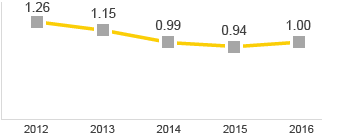
In 2016, TRCF slightly increased compared to 2015. (See Safety performance).
Progress in 2016
Total recordable case frequency (TRCF)

Priorities in 2017
- For road safety, continue to replicate proven practices from existing programmes across all lines of business.
- Support application of common industry safety standards.
- Continue to leverage insights from assurance and investigations of incidents with potential to cause harm.
Process safety
Process safety
2016 Goal
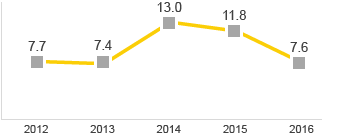
Achieve a number of operational leaks below 54 (classified as “operational Tier 1 process safety events”).
Since 2011, we have extended our ambition of Goal Zero to process safety.
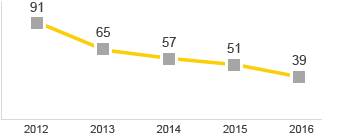
In 2016, the number of process safety events has decreased again for both categories – Tier 1 and Tier 2 – to our lowest reported total. (See Safety).
Progress in 2016
Number of operational process safety Tier 1 events

Priorities in 2017
- Keep a strong focus on asset integrity and operational task execution.
- Improve learning from process safety events with high potential impact.
Environment
Environment
2016 Goal
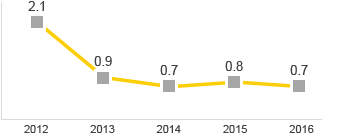
Achieve operational spills below a volume of 0.7 (‘000 tonnes) (classified as “hydrocarbons reaching soil or water”).
Goal Zero also extends to the environment with our goal of no operational spills.
The volume of operational spills decreased slightly. We continued to reduce the number of operational spills significantly in 2016 (72) compared to 2015 (108). (See Operational Spills).
Progress in 2016
Volume of operational spills in ‘000 tonnes

Priorities in 2017
- Keep focus on improving the reliability of our facilities to reduce the number and volume of operational spills.
- Continue to work with the oil and gas industry to further develop effective oil-spill emergency response capacities.
GHG & Energy
GHG & Energy
2016 Goal
Reduce flaring in our upstream business (million tonnes CO2 equivalent).
Our policy is to reduce any continuous flaring or venting to as low a level as reasonably practical.
We are a signatory of the World Bank's “Zero Routine Flaring 2030” initiative.
With measures implemented in 2016, we reduced routine flaring at our facilities significantly, even though we increased production and number of facilities. (See Flaring).

Priorities in 2017
- Link all Shell staff performance bonuses to the management of greenhouse gas emissions, including the reduction of flaring.
- Work with the World Bank and focus on finding solutions to host-government funding for flaring projects.
GHG & energy
GHG & energy
2016 Goal
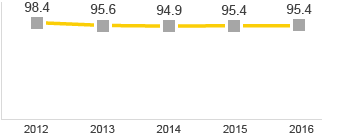
Energy Intensity < 92.2
Achieve a refinery energy intensity below 92.2 (based on the Refineries Energy Index).
We aim to achieve top level energy-efficiency performance in our refineries.
Improve energy efficiency to reduce our greenhouse gas emissions.
The energy intensity of our refineries remained at similar levels to 2015. This was due to operational issues and improvement initiatives not fully delivering against plans. (See Energy efficiency).
Progress in 2016
Refinery energy intensity as Refineries Energy Index

Priorities in 2017
- Link all Shell staff performance bonuses to the management of greenhouse gas emissions, including the reduction of refining GHG intensity.
- Continue to focus on maintenance measures that enhance the reliability of our equipment.
- Ensure sharing of tools and practices across Shell.
Social
Social
2016 Goal
Effective community feedback
Our community feedback mechanism (CFM) has been used to address community concerns since 2012. We continue to progress the implementation of our standard online community feedback tool which helps to strengthen tracking and reporting of concerns.
Progress in 2016
We implemented our online community feedback tool across almost all our upstream operations.
At the refineries in our Downstream business, we introduced the full range of community feedback categories. As a result, we are now able to evaluate data in the categories beyond environmental complaints, including, for example, stakeholder engagement, property issues and local benefit sharing. (See Social performance).
Priorities in 2017
- Implementation of our online community feedback tool across all major operational sites and projects under development in different lines of business: Upstream, Downstream and Integrated Gas and New Energies.
- Perform a pilot project to assess the effectiveness of our CFM against the UN Guiding Principles on Business and Human Rights effectiveness criteria.