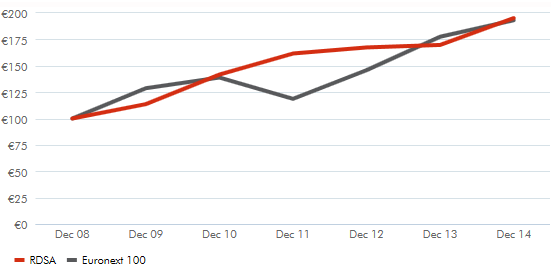
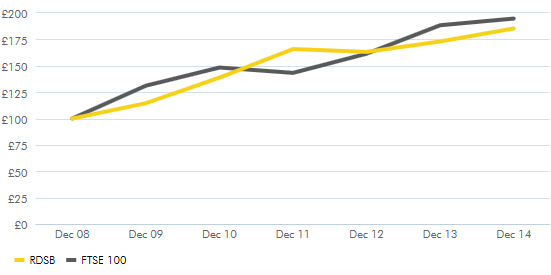
Growth in the value of a hypothetical €100 holding and £100 holding over six years. Euronext 100 and FTSE 100 comparison based on 30 trading day average values.
Historical TSR performance of Royal Dutch Shell plc
RDSA VERSUS EURONEXT 100 value of hypothetical €100 holding
RDSB VERSUS FTSE 100 value of hypothetical £100 holding
The following table shows the high, low and year-end prices of the Company’s registered ordinary shares:
- of €0.07 nominal value on the London Stock Exchange;
- of €0.07 nominal value on Euronext Amsterdam; and
- in the form of ADSs on the New York Stock Exchange (ADSs do not have a nominal value).
| Download XLS |
|
SHARE PRICES | ||||||
|---|---|---|---|---|---|---|
|
|
Euronext Amsterdam |
New York Stock Exchange | ||||
|
|
A shares |
A ADSs | ||||
|
|
High |
Low |
Year-end |
High |
Low |
Year-end |
|
2010 |
25.28 |
19.53 |
24.73 |
68.54 |
49.16 |
66.78 |
|
2011 |
28.40 |
20.12 |
28.15 |
77.96 |
57.97 |
73.09 |
|
2012 |
29.18 |
24.30 |
25.98 |
74.51 |
60.62 |
68.95 |
|
2013 |
27.06 |
23.40 |
25.91 |
73.00 |
62.65 |
71.27 |
|
2014 |
31.13 |
24.30 |
27.66 |
83.42 |
60.84 |
66.95 |
|
|
|
|
|
|
|
|
|
|
London Stock Exchange |
New York Stock Exchange | ||||
|
|
B shares |
B ADSs | ||||
|
|
High |
Low |
Year-end |
High |
Low |
Year-end |
|
2010 |
2,149 |
1,550 |
2,115 |
68.32 |
47.12 |
66.67 |
|
2011 |
2,476 |
1,768 |
2,454 |
78.75 |
58.42 |
76.01 |
|
2012 |
2,499 |
2,020 |
2,175 |
77.52 |
63.05 |
70.89 |
|
2013 |
2,375 |
2,070 |
2,280 |
75.18 |
65.02 |
75.11 |
|
2014 |
2,614 |
1,985 |
2,233 |
88.13 |
62.11 |
69.56 |