Downstream overview
In 2015, our Downstream business
- Achieved the highest CCS earnings excluding identified items ($9.7 billion) since the inception of Downstream more than 10 years ago, despite a reduced portfolio base. Refining earnings were particularly strong, driven by higher industry margins and improved availability in 2015.
- Return on average capital employed topped 20% for 2015; the highest since the end 2005 driven in part by strong earnings.
- We took three final investment decisions in Downstream to:
- add 425 thousand tonnes per year of alpha olefins production capacity at Geismar, Louisiana, USA.
- proceed with the debottlenecking project at Scotford refinery, Canada.
- build a solvent deasphalter unit at the Pernis refinery, the Netherlands.
- Announced the divestment of our 33.24% holding in Showa Shell in Japan to Idemitsu for approximately $1.4 billion. We will retain a 1.80% interest, with completion expected in 2016.
- Sold additional interests in Shell Midstream Partners, L.P., in the USA, to public investors via the issuance of limited partnership units, reducing our interest in the partnership to 60% and generating proceeds of $595 million.
So far in 2016
- In the Chemicals business we took the FID on expansion of our existing joint venture with China National Offshore Oil Corporation (CNOOC) in Guangdong province, China. The heads of agreement was signed in 2015.
- In 2016, we took the FID to build a major petrochemicals complex, near Pittsburgh, Pennsylvania, USA.
- Signed a non-binding letter of intent with Saudi Aramco (SA) to discontinue the Motiva joint venture in the USA. Motiva’s assets will be divided between Shell and SA.
- Also in the USA, we sold additional interests in Shell Midstream Partners, L.P., reducing our interest to 54% and generating proceeds of $421 million.
Downstream – key statistics |
|||||||
|---|---|---|---|---|---|---|---|
|
2015 |
2014 |
2013 |
2012 |
2011 |
||
|
|||||||
CCS earnings ($ million), of which: |
10,243 |
3,411 |
3,869 |
5,382 |
4,170 |
||
Oil products |
8,654 |
1,994 |
2,026 |
4,008 |
2,136 |
||
Chemicals |
1,589 |
1,417 |
1,843 |
1,374 |
2,034 |
||
CCS earnings excluding identified items ($ million) |
9,748 |
6,265 |
4,466 |
5,343 |
4,155 |
||
Cash flow from operations ($ million) |
14,076 |
11,292 |
7,903 |
11,111 |
4,921 |
||
Oil products sales volumes (thousand b/d) |
6,432 |
6,365 |
6,164 |
6,235 |
6,196 |
||
Chemicals sales volumes (thousand tonnes) |
17,148 |
17,008 |
17,386 |
18,669 |
18,831 |
||
Refinery processing intake (thousand b/d) |
2,805 |
2,903 |
2,915 |
2,819 |
2,845 |
||
Refinery availability (%) [A] |
90 |
93 |
94 |
92 |
90 |
||
Chemical plant availability (%) |
85 |
85 |
92 |
91 |
89 |
||
Capital investment ($ million) |
5,119 |
5,910 |
5,528 |
5,454 |
7,548 |
||
Capital employed ($ million) |
46,280 |
48,925 |
64,507 |
62,426 |
64,237 |
||
Employees (thousands) |
43 |
47 |
48 |
48 |
51 |
||
Downstream CCS earnings and cash flow from operations [A]
$ billion
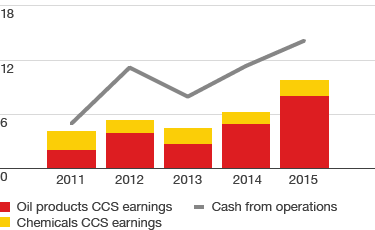

[A] CCS earnings excluding identified items.
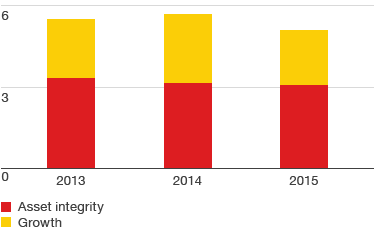
Downstream capital investment
$ billion