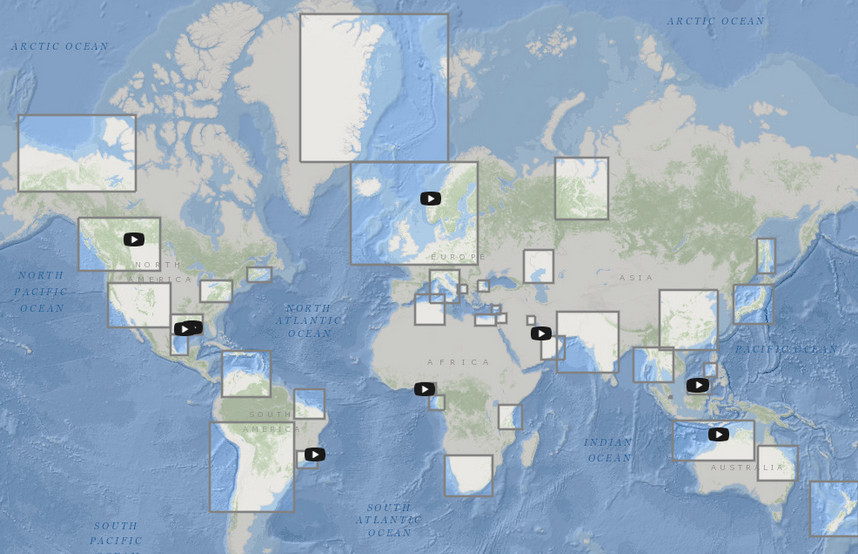
Shell reporting suite 2018

Close
  • Annual Report and Form 20-F Launch in March 2019
  • Sustainability Report Launch in April 2019
  • Investors’ Handbook Launch in April 2019
  • Tax Contribution Report Launch in December 2019
  • Reports Summary
Jump to content [AK + s] Jump to navigation [AK + 3]
Shell

Shell Investors’ Handbook 2014-2018

Menu

  • Home
  • Company overview
    • Our businesses and organisation
    • Strategy
      • Strategic themes
    • Environmental, social and governance
    • Overall highlights in 2018
    • Results
    • Market overview
    • Financial framework
    • Projects
    • Outlook
    • Top Topics

      • Introduction from the CEO

      • Overall highlights in 2018

      • Financial framework

      Tools

      • Interactive chart tool
      • Download centre
      • Interactive world map
  • Integrated Gas
    • Integrated Gas overview
    • LNG
    • In Focus: LNG Canada
    • GTL
    • New Energies
    • Regional overview
      • Europe
      • Asia (including Middle East and Russia)
      • Africa
      • Oceania
      • North America
      • South America
    • Top Topics

      • Introduction from the CEO

      • Overall highlights in 2018

      • Financial framework

      Tools

      • Interactive chart tool
      • Download centre
      • Interactive world map
  • Upstream
    • Upstream overview
    • Conventional Oil & Gas
    • Deep water
    • In Focus: Brazil
    • Shales
    • In Focus: Permian
    • Exploration
    • Regional overview
      • Europe
      • Asia (including Middle East)
      • Africa
      • North America
      • South America
    • Top Topics

      • Introduction from the CEO

      • Overall highlights in 2018

      • Financial framework

      Tools

      • Interactive chart tool
      • Download centre
      • Interactive world map
  • Downstream
    • Downstream overview
    • Oil Products
      • Refining and Trading
      • Marketing
    • In Focus: IMO 2020
    • Chemicals
    • Top Topics

      • Introduction from the CEO

      • Overall highlights in 2018

      • Financial framework

      Tools

      • Interactive chart tool
      • Download centre
      • Interactive world map
  • Projects & Technology
    • Projects & Technology overview
    • Project delivery
    • Asset support
    • Technology commercialisation
    • Contracting and procurement
    • Safety and environment
    • In Focus: Digitalisation
    • Top Topics

      • Introduction from the CEO

      • Overall highlights in 2018

      • Financial framework

      Tools

      • Interactive chart tool
      • Download centre
      • Interactive world map
  • Corporate segment
  • Maps
    • Europe
    • Africa
    • Asia
    • Oceania
    • North America
    • South America
    • Top Topics

      • Introduction from the CEO

      • Overall highlights in 2018

      • Financial framework

      Tools

      • Interactive chart tool
      • Download centre
      • Interactive world map
  • Data
    • Employee data
    • Financial data
      • Financial statements information
      • Financial ratios
      • Quarterly data by segment
      • Additional segmental information and capital data
    • Exploration and production data
      • Oil and gas exploration and production activities earnings
      • Proved oil and gas reserves
      • Changes to proved oil and gas reserves
      • Oil, gas, synthetic crude oil and bitumen production
      • Acreage and wells
    • Additional Integrated Gas data
    • Downstream data
      • Oil products
      • Refineries in operation
      • Oil sales and retail sites
      • Chemicals
      • Chemical plants in operation
    • Additional investor information
      • Share information
      • Dividends
      • Bondholder information
      • Financial calendar in 2019 and contacts
    • Top Topics

      • Introduction from the CEO

      • Overall highlights in 2018

      • Financial framework

      Tools

      • Interactive chart tool
      • Download centre
      • Interactive world map
  • Back to Shell Global
  • Reports Summary
  • Investors’ Handbook 2014-2018
Search
Menu
Search

Search

Your recent searches

Top searches

Quick links

  • Our businesses and organisation
  • Overall highlights in 2018
  • Projects
  • Financial data

You are here:

  • Reports
  • Investors’ Handbook
  • Maps
Previous articleCorporate segment
Do you need to print this article?
Next articleEurope
Compare to last year

Maps

-1 Maps Shell Investors’ Handbook 2014-2018

This section shows the location of our physical assets around the world.

Inside Maps

  • Europe
  • Africa
  • Asia
  • Oceania
  • North America
  • South America

Tools

  • Interactive chart tool Build your own interactive charts
  • Download centre Find all the files and previous reports
  • Interactive world map Shell's activities around the globe
  • Compare to last yearCompare to 2017’s report
World map showing selected Shell assets across the globe (world map)

Featured

Interactive world map

Take a view on Shell's activities around the globe and zoom in on assets, projects and facilities.


Have a look at some examples of areas where Shell applies digital technologies to create more value.

Do you need to print this article?
Compare to last year
Previous articleCorporate segment
Next articleEurope

Explore

Next article

Europe

Maps

  • Europe
  • Africa
  • Asia
  • Oceania
  • North America
  • South America

Connect with Shell

  • Facebook
  • Twitter
  • Instagram
  • LinkedIn
  • YouTube

Site information

  • Sitemap
  • About this publication
  • Abbreviations
  • Contact us
  • Accessibility
  • Terms and conditions
  • Privacy policy
  • Cookie policy
  • Cookie settings
Back to Top
nexxar - digital reporting evolved - Online Report