Economic performance
During 2015, significantly lower oil and gas prices challenged our industry, with an average Brent price of $52 a barrel. Our integrated business and improved operational performance helped reduce the impact of lower energy prices.
Dividends distributed


Cash flow from operating activities
Capital investment
We are managing our business through the current oil price downturn which underpins our intention to continue to pay attractive dividends to shareholders while investing for the future. In 2015, we reduced our operating costs and capital spending; restructured our upstream business, tight and shale gas, and oil products; sold assets worth $20 billion in 2014–15; and delivered new projects with substantial cash flow potential.
Our income in 2015 was $1.9 billion, impacted by significantly lower oil and gas prices during the year. In 2015, the average Brent price was $52, down 47% from 2014. We distributed dividends of some $12 billion to our shareholders of which $2.6 billion was taken in shares through our scrip dividend programme.
We reduced our total capital investment to $29 billion to reflect the falling oil price and focused on progressing only the most competitive projects, which will help to build and sustain our business for the future. We completed divestments of $5 billion from our non-core portfolio, including proceeds from the USA’s midstream master limited partnership. We also spent $1,093 million on our research and development programme.
Shell generated $29.8 billion of cash flow from its operating activities in 2015.
In 2015, we started up our Corrib facility in Ireland (Shell interest 45%) and Bonga Phase 3 (Shell interest 55%), off the coast of Nigeria. Only the most competitive projects are going ahead: in the same year, we took just four major final investment decisions, three of which were in Downstream. We also announced the cancellation of the Alaska exploration project and Carmon Creek heavy oil project and in early 2016, we postponed the final investment decisions on LNG Canada and Bonga South West.
Shell’s oil and gas production in 2015 was 3 million boe a day, down 4% from 2014. Our sales of liquefied natural gas decreased to around 22.6 million tonnes.
Following the announcement of a recommended offer in April 2015, Shell completed the acquisition of BG Group plc in February 2016. This acquisition will mark the start of a new chapter in Shell. It rejuvenates Shell’s Upstream business by adding more deep-water and integrated gas to our portfolio. These are areas where Shell has significant capabilities and technologies.
Shell is becoming a company that is more focused on its core strengths, and more resilient and competitive throughout the oil price cycle.
Scorecard structure
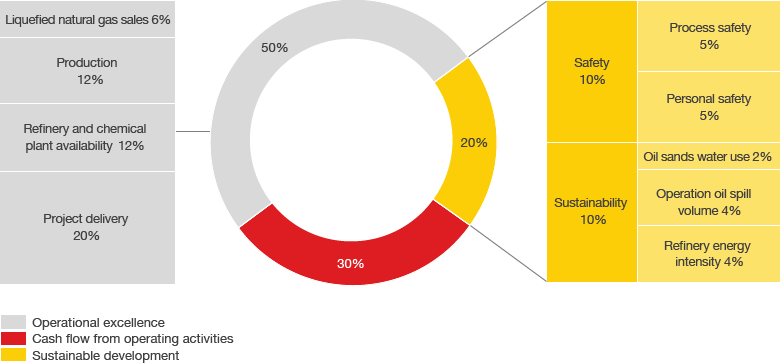

Executive scorecard
In 2015, sustainable development continued to account for 20% of the company scorecard, which helps determine the annual bonus levels for all our employees, including members of the Shell Executive Committee (EC).
In 2015, the EC’s sustainable development measures were split evenly between Shell’s safety and environmental performance. Our environmental measures cover operational spill volume, energy efficiency and use of fresh water. From 2015, process safety Tier 1 events were introduced as a new measure for safety, with an equal weighting for personal safety. These measures reflect Shell’s Goal Zero ambition of no harm and no leaks.
Targets are set each year by the Board’s Remuneration Committee, taking into account performance over the past three years in order to incentivise continuous and sustained improvement. In 2015, our performance was better than the target for all sustainable development measures and was our strongest result to date.