 Climate change
 Sustainable development goals
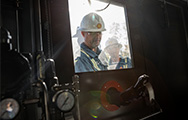 Safety
 About our data
Preparing for emergencies
We seek to ensure we have the necessary resources to deal with spills, leaks, fires and explosions, both offshore and onshore. We regularly test our response procedures and capability so we can respond rapidly to an incident.
Visit www.shell.com/sustainability/safety/process-safety for more on our emergency response.
In 2019, we trained around 950 employees and contractors on five large-scale oil spill exercises – one in Australia, one in Denmark and three in the USA. All the exercises involved our emergency response contractors, joint-venture partners and local authorities to test our organisational capability to manage a worst-case spill incident.
For example, at the Prelude floating liquefied natural gas facility in Australia (Shell interest 67.5%), a three-day exercise simulated a loss of well control that resulted in an uncontrolled flow of gas and condensate (a light oil by-product of gas production). The simulation tested procedures to contain the release, such as deploying floating barriers and applying dispersant to the oil.
Spills
Shell has requirements and procedures in place to prevent operational spills. We have routine programmes to maintain facilities and pipelines, and improve their reliability, to reduce spills.
However, spills still occur for reasons such as operational failure, accidents or unusual corrosion. We investigate and learn from all spills to improve our performance and aim to clean up the areas around operations that are affected by spills, irrespective of the cause.
Spills performance
The volume of operational spills of oil and oil products in 2019 was 0.2 thousand tonnes, a significant decrease from 0.9 thousand tonnes in 2018. The number of operational spills of more than 100 kilograms decreased to 70 in 2019 from 93 in 2018. We have programmes in place to reduce the number of operational spills over the long term.
Spills – operational [A]
Enlarge image
[A] Over 100 kilograms.
Spills – sabotage [A]
Enlarge image
[A] Sabotage- and theft-related spills of more than 100 kilograms. All sabotage- and theft-related spills occurred in Nigeria, except in 2016 (0.001 thousand tonnes) and 2015 (0.005 thousand tonnes).
The number of spills caused by sabotage and theft rose to 156 in 2019 from 109 in 2018. The volume of these spills increased to 2.0 thousand tonnes in 2019 from 1.6 thousand tonnes in 2018. Sabotage and oil theft remained a significant cause of spills in the Niger Delta, Nigeria.