 Our businesses and organisation
 Overall highlights in 2019
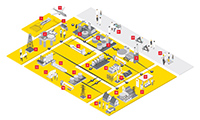
 Projects & Technology overview
 Financial data
Results
|
|
2019 |
2018 |
2017 |
2016 |
2015 |
||||
|---|---|---|---|---|---|---|---|---|---|
|
Income attributable to Royal Dutch Shell plc shareholders |
15,842 |
23,352 |
12,977 |
4,575 |
1,939 |
||||
|
CCS adjustment [A] |
572 |
(481) |
896 |
1,042 |
(1,903) |
||||
|
CCS earnings attributable to shareholders |
15,270 |
23,833 |
12,081 |
3,533 |
3,842 |
||||
|
Identified items [A] |
(1,192) |
2,429 |
(3,683) |
(3,652) |
(7,604) |
||||
|
CCS earnings attributable to shareholders excluding identified items |
16,462 |
21,404 |
15,764 |
7,185 |
11,446 |
||||
|
Less: Non-controlling interest |
(535) |
(531) |
(418) |
(270) |
(316) |
||||
|
CCS earnings excluding identified items |
16,997 |
21,935 |
16,182 |
7,455 |
11,762 |
||||
|
Integrated Gas |
8,955 |
9,399 |
5,268 |
3,700 |
5,057 |
||||
|
Upstream |
4,744 |
6,775 |
3,091 |
(2,704) |
(2,255) |
||||
|
Downstream (CCS basis) |
6,680 |
7,567 |
9,082 |
7,243 |
9,748 |
||||
|
Corporate |
(3,383) |
(1,806) |
(1,259) |
(784) |
(788) |
||||
|
Basic CCS earnings per share ($) |
1.89 |
2.88 |
1.47 |
0.45 |
0.61 |
||||
|
CCS adjustment per share ($) |
0.07 |
(0.06) |
0.11 |
0.13 |
(0.30) |
||||
|
Basic earnings per share ($) |
1.97 |
2.82 |
1.58 |
0.58 |
0.31 |
||||
|
Basic earnings per ADS ($) |
3.94 |
5.64 |
3.16 |
1.16 |
0.62 |
||||
|
Cash flow from operating activities |
42,179 |
53,085 |
35,650 |
20,615 |
29,810 |
||||
|
Dividend per share ($) [B] |
1.88 |
1.88 |
1.88 |
1.88 |
1.88 |
||||
|
Dividend per ADS ($) [B] |
3.76 |
3.76 |
3.76 |
3.76 |
3.76 |
||||
|
|||||||||
CCS earnings
$ billion

Cash flow from operating activities
$ billion

ROACE 2019 [A]
%

[A] European companies: CCS basis excluding identified items.
US companies: reported earnings excluding special non-operating items. Capital employed on gross debt basis
Total shareholder return 2019
%