 Our businesses and organisation
 Overall highlights in 2019
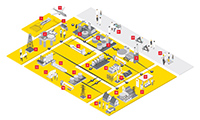
 Projects & Technology overview
 Financial data
Quarterly data by segment
|
2019 |
2018 |
||||||||||
|---|---|---|---|---|---|---|---|---|---|---|---|---|
|
Q1 |
Q2 |
Q3 |
Q4 |
Year |
Q1 |
Q2 |
Q3 |
Q4 |
Year |
||
Integrated Gas |
2,795 |
1,340 |
2,597 |
1,897 |
8,628 |
2,391 |
3,358 |
2,116 |
3,579 |
11,444 |
||
Upstream |
|
|
|
|
|
|
|
|
|
|
||
Europe |
105 |
114 |
858 |
(816) |
261 |
(194) |
291 |
287 |
162 |
546 |
||
Asia |
518 |
405 |
306 |
740 |
1,969 |
1,141 |
749 |
637 |
601 |
3,128 |
||
Oceania |
– |
– |
– |
– |
– |
– |
– |
– |
– |
– |
||
Africa |
291 |
213 |
176 |
109 |
789 |
326 |
306 |
413 |
534 |
1,579 |
||
North America |
635 |
624 |
729 |
(660) |
1,327 |
449 |
329 |
1,473 |
339 |
2,590 |
||
South America |
156 |
198 |
(347) |
(160) |
(152) |
132 |
(581) |
(561) |
(35) |
(1,045) |
||
Total Upstream |
1,706 |
1,554 |
1,722 |
(787) |
4,195 |
1,854 |
1,094 |
2,249 |
1,601 |
6,798 |
||
Downstream (CCS basis) |
|
|
|
|
|
|
|
|
|
|
||
Refining & Trading |
30 |
(47) |
831 |
23 |
837 |
107 |
(308) |
179 |
1,583 |
1,561 |
||
Marketing |
1,113 |
1,225 |
1,531 |
1,091 |
4,961 |
1,015 |
929 |
964 |
1,248 |
4,156 |
||
Oil Products |
1,142 |
1,179 |
2,362 |
1,115 |
5,798 |
1,122 |
621 |
1,143 |
2,831 |
5,717 |
||
Chemicals |
452 |
(107) |
211 |
(78) |
479 |
684 |
547 |
566 |
87 |
1,884 |
||
Total Downstream |
1,595 |
1,072 |
2,574 |
1,037 |
6,277 |
1,806 |
1,168 |
1,709 |
2,918 |
7,601 |
||
Corporate |
(671) |
(789) |
(663) |
(1,151) |
(3,273) |
(227) |
(273) |
(335) |
(644) |
(1,479) |
||
Non-controlling interest |
(131) |
(152) |
(149) |
(125) |
(557) |
(121) |
(121) |
(169) |
(120) |
(531) |
||
CCS earnings attributable to shareholders |
5,293 |
3,025 |
6,081 |
871 |
15,270 |
5,703 |
5,226 |
5,570 |
7,334 |
23,833 |
||
CCS adjustment [A] |
(708) |
27 |
202 |
(94) |
(573) |
(196) |
(798) |
(269) |
1,744 |
481 |
||
Income/(loss) attributable to Royal Dutch Shell plc shareholders |
6,001 |
2,998 |
5,879 |
965 |
15,843 |
5,899 |
6,024 |
5,839 |
5,590 |
23,352 |
||
|
||||||||||||
|
2017 |
2016 |
2015 |
||||||||||||||
|---|---|---|---|---|---|---|---|---|---|---|---|---|---|---|---|---|---|
|
Q1 |
Q2 |
Q3 |
Q4 |
Year |
Q1 |
Q2 |
Q3 |
Q4 |
Year |
Q1 |
Q2 |
Q3 |
Q4 |
Year |
||
Integrated Gas |
1,822 |
1,191 |
1,217 |
848 |
5,078 |
905 |
982 |
614 |
28 |
2,529 |
1,139 |
1,335 |
(429) |
1,125 |
3,170 |
||
Upstream |
|
|
|
|
|
|
|
|
|
|
|
|
|
|
|
||
Europe |
309 |
(138) |
27 |
1,560 |
1,758 |
(86) |
(820) |
12 |
495 |
(399) |
957 |
(76) |
(40) |
241 |
1,082 |
||
Asia |
251 |
284 |
85 |
477 |
1,097 |
(18) |
(83) |
91 |
(113) |
(123) |
195 |
114 |
(26) |
(206) |
77 |
||
Oceania |
– |
– |
– |
– |
– |
– |
– |
– |
– |
– |
– |
– |
– |
– |
– |
||
Africa |
69 |
176 |
394 |
1,124 |
1,763 |
(92) |
34 |
269 |
(139) |
72 |
1,484 |
220 |
173 |
(98) |
1,779 |
||
North America |
(1,166) |
(520) |
46 |
(854) |
(2,494) |
(1,153) |
(1,061) |
(917) |
56 |
(3,075) |
(882) |
(762) |
(7,827) |
(977) |
(10,448) |
||
South America |
7 |
(346) |
23 |
(257) |
(573) |
(1) |
(44) |
160 |
(264) |
(149) |
(354) |
(57) |
(494) |
(418) |
(1,323) |
||
Total Upstream |
(530) |
(544) |
575 |
2,050 |
1,551 |
(1,350) |
(1,974) |
(385) |
35 |
(3,674) |
1,400 |
(561) |
(8,214) |
(1,458) |
(8,833) |
||
Downstream (CCS basis) |
|
|
|
|
|
|
|
|
|
|
|
|
|
|
|
||
Refining & Trading |
870 |
193 |
571 |
19 |
1,653 |
181 |
509 |
(42) |
(72) |
576 |
1,136 |
1,192 |
1,043 |
733 |
4,104 |
||
Marketing |
895 |
1,376 |
1,104 |
548 |
3,923 |
1,113 |
981 |
1,117 |
1,153 |
4,364 |
978 |
1,051 |
930 |
1,591 |
4,550 |
||
Oil Products |
1,765 |
1,569 |
1,675 |
567 |
5,576 |
1,294 |
1,490 |
1,075 |
1,081 |
4,940 |
2,114 |
2,243 |
1,973 |
2,324 |
8,654 |
||
Chemicals |
815 |
588 |
730 |
549 |
2,682 |
406 |
227 |
521 |
494 |
1,648 |
400 |
503 |
508 |
178 |
1,589 |
||
Total Downstream |
2,580 |
2,157 |
2,405 |
1,116 |
8,258 |
1,700 |
1,717 |
1,596 |
1,575 |
6,588 |
2,514 |
2,746 |
2,481 |
2,502 |
10,243 |
||
Corporate |
(410) |
(774) |
(394) |
(838) |
(2,416) |
(456) |
(423) |
(306) |
(566) |
(1,751) |
(171) |
(68) |
109 |
(295) |
(425) |
||
Non-controlling interest |
(81) |
(110) |
(105) |
(94) |
(390) |
15 |
(63) |
(71) |
(40) |
(159) |
(121) |
(91) |
(67) |
(34) |
(313) |
||
CCS earnings attributable to shareholders |
3,381 |
1,920 |
3,698 |
3,082 |
12,081 |
814 |
239 |
1,448 |
1,032 |
3,533 |
4,761 |
3,361 |
(6,120) |
1,840 |
3,842 |
||
CCS adjustment [A] |
(157) |
375 |
(389) |
(725) |
(896) |
(330) |
936 |
(73) |
509 |
1,042 |
(331) |
625 |
(1,296) |
(901) |
(1,903) |
||
Income attributable to Royal Dutch Shell plc shareholders |
3,538 |
1,545 |
4,087 |
3,807 |
12,977 |
484 |
1,175 |
1,375 |
1,541 |
4,575 |
4,430 |
3,986 |
(7,416) |
939 |
1,939 |
||
|
|||||||||||||||||
|
2019 |
2018 |
||||||||
|---|---|---|---|---|---|---|---|---|---|---|
|
Q1 |
Q2 |
Q3 |
Q4 |
Year |
Q1 |
Q2 |
Q3 |
Q4 |
Year |
Integrated Gas |
226 |
(386) |
(77) |
(89) |
(326) |
(48) |
1,053 |
(176) |
1,216 |
2,045 |
Upstream |
|
|
|
|
|
|
|
|
|
|
Europe |
(5) |
39 |
710 |
(121) |
623 |
(245) |
156 |
82 |
(230) |
(237) |
Asia |
1 |
– |
(12) |
7 |
(4) |
574 |
239 |
– |
18 |
831 |
Oceania |
– |
– |
– |
– |
– |
– |
– |
– |
– |
– |
Africa |
– |
(6) |
(46) |
(15) |
(67) |
1 |
(7) |
– |
10 |
4 |
North America |
3 |
134 |
425 |
(1,334) |
(772) |
(2) |
(207) |
394 |
(182) |
3 |
South America |
(18) |
52 |
(261) |
(102) |
(330) |
(25) |
(544) |
(113) |
104 |
(578) |
Total Upstream |
(19) |
219 |
815 |
(1,564) |
(549) |
303 |
(363) |
363 |
(280) |
23 |
Downstream (CCS basis) |
|
|
|
|
|
|
|
|
|
|
Refining & Trading |
(313) |
(27) |
383 |
(439) |
(396) |
(34) |
(422) |
(245) |
749 |
48 |
Marketing |
84 |
– |
51 |
121 |
255 |
75 |
(59) |
(85) |
247 |
178 |
Oil Products |
(229) |
(27) |
433 |
(318) |
(141) |
41 |
(481) |
(330) |
996 |
226 |
Chemicals |
2 |
(239) |
(13) |
(13) |
(263) |
(1) |
(11) |
29 |
(209) |
(192) |
Total Downstream (CCS basis) |
(227) |
(266) |
421 |
(331) |
(404) |
40 |
(492) |
(301) |
787 |
34 |
Corporate |
13 |
18 |
154 |
(76) |
109 |
7 |
337 |
60 |
(77) |
327 |
Non-controlling interest |
– |
(22) |
– |
– |
(22) |
– |
– |
– |
– |
– |
Impact on CCS earnings attributable to shareholders |
(8) |
(437) |
1,313 |
(2,060) |
(1,192) |
302 |
535 |
(54) |
1,646 |
2,429 |
|
2017 |
2016 |
2015 |
||||||||||||
|---|---|---|---|---|---|---|---|---|---|---|---|---|---|---|---|
|
Q1 |
Q2 |
Q3 |
Q4 |
Year |
Q1 |
Q2 |
Q3 |
Q4 |
Year |
Q1 |
Q2 |
Q3 |
Q4 |
Year |
Integrated Gas |
641 |
22 |
(65) |
(788) |
(190) |
(89) |
114 |
(317) |
(879) |
(1,171) |
(352) |
(68) |
(1,347) |
(120) |
(1,887) |
Upstream |
|
|
|
|
|
|
|
|
|
|
|
|
|
|
|
Europe |
86 |
(331) |
(67) |
1,065 |
753 |
(21) |
(597) |
140 |
(40) |
(518) |
547 |
43 |
(153) |
(174) |
263 |
Asia |
– |
– |
(44) |
210 |
166 |
(3) |
(24) |
(15) |
(246) |
(288) |
(31) |
(3) |
(111) |
(30) |
(175) |
Oceania |
– |
– |
– |
– |
– |
– |
– |
– |
– |
– |
– |
– |
– |
– |
– |
Africa |
(90) |
(8) |
(98) |
389 |
193 |
(5) |
(11) |
86 |
(8) |
62 |
1,417 |
(2) |
(2) |
(29) |
1,384 |
North America |
(1,136) |
(361) |
42 |
(1,081) |
(2,536) |
(52) |
(354) |
(478) |
404 |
(480) |
(84) |
(168) |
(7,037) |
(93) |
(7,382) |
South America |
70 |
(183) |
180 |
(183) |
(116) |
168 |
337 |
(122) |
(129) |
254 |
(254) |
38 |
(329) |
(123) |
(668) |
Total Upstream |
(1,070) |
(883) |
13 |
400 |
(1,540) |
87 |
(649) |
(389) |
(19) |
(970) |
1,595 |
(92) |
(7,632) |
(449) |
(6,578) |
Downstream (CCS basis) |
|
|
|
|
|
|
|
|
|
|
|
|
|
|
|
Refining & Trading |
155 |
(567) |
(320) |
(77) |
(809) |
(481) |
50 |
(313) |
(149) |
(893) |
(126) |
(121) |
(1) |
22 |
(226) |
Marketing |
(43) |
231 |
(23) |
(240) |
(75) |
142 |
(128) |
(148) |
407 |
273 |
3 |
(34) |
(111) |
960 |
818 |
Oil Products |
112 |
(336) |
(343) |
(317) |
(884) |
(339) |
(78) |
(461) |
258 |
(620) |
(123) |
(155) |
(112) |
982 |
592 |
Chemicals |
(21) |
(36) |
80 |
37 |
60 |
29 |
(21) |
(21) |
(22) |
(35) |
(9) |
(60) |
(24) |
(4) |
(97) |
Total Downstream (CCS basis) |
91 |
(372) |
(263) |
(280) |
(824) |
(310) |
(99) |
(482) |
236 |
(655) |
(132) |
(215) |
(136) |
978 |
495 |
Corporate |
(63) |
(451) |
(90) |
(553) |
(1,157) |
(525) |
(189) |
(152) |
(101) |
(967) |
(88) |
(27) |
619 |
(141) |
363 |
Non-controlling interest |
28 |
– |
– |
– |
28 |
98 |
17 |
(4) |
– |
111 |
– |
3 |
– |
– |
3 |
Impact on CCS earnings attributable to shareholders |
(373) |
(1,684) |
(405) |
(1,221) |
(3,683) |
(739) |
(806) |
(1,344) |
(763) |
(3,652) |
1,023 |
(399) |
(8,496) |
268 |
(7,604) |
Identified items
Identified items comprise: divestment gains and losses, impairments, fair value accounting of commodity derivatives and certain gas contracts, redundancy and restructuring, the impact of exchange rate movements on certain deferred tax balances, and other items. These items, either individually or collectively, can cause volatility to net income, in some cases driven by external factors, which may hinder the comparative understanding of Shell’s financial results from period to period. A description of Shell’s identified items per quarter can be found in the Quarterly Results Announcements.