 Our businesses and organisation
 Overall highlights in 2019
 Projects & Technology overview
 Financial data
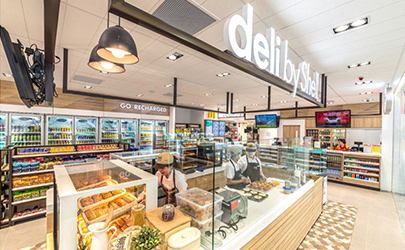
Downstream overview
Divestments
- In the Kingdom of Saudi Arabia, we completed the sale of our 50% interest in Shell Saudi Arabia (Refining) Limited (SASREF), a joint venture in Jubail Industrial City, to Saudi Arabian Oil Company (Saudi Aramco) for $631 million.
- In the USA, our subsidiary Equilon Enterprises LLC, doing business as Shell Oil Products US, announced in June 2019 that we reached an agreement for the sale of Martinez Refinery in California to PBF Holding Company LLC for a $1.0 billion consideration. The sale was concluded in February 2020 in exchange for $1.2 billion which includes the refinery and inventory.
- Also in the USA, in March 2020, we announced our intention to sell the Puget Sound refinery in Washington and the Mobile site in Alabama.
|
|
2019 |
2018 |
2017 |
2016 |
2015 |
||||
|---|---|---|---|---|---|---|---|---|---|
|
CCS earnings ($ million), of which: |
6,277 |
7,601 |
8,258 |
6,588 |
10,243 |
||||
|
Oil Products |
5,798 |
5,717 |
5,576 |
4,940 |
8,654 |
||||
|
Chemicals |
479 |
1,884 |
2,682 |
1,648 |
1,589 |
||||
|
CCS earnings excluding identified items ($ million) |
6,680 |
7,567 |
9,082 |
7,243 |
9,748 |
||||
|
Cash flow from operating activities ($ million) |
7,296 |
13,928 |
12,429 |
3,556 |
14,076 |
||||
|
Oil Products sales volumes (thousand b/d) |
6,561 |
6,783 |
6,599 |
6,483 |
6,432 |
||||
|
Chemicals sales volumes (thousand tonnes) |
15,223 |
17,644 |
18,239 |
17,292 |
17,148 |
||||
|
Refinery processing intake (thousand b/d) |
2,564 |
2,648 |
2,572 |
2,701 |
2,805 |
||||
|
Refinery availability (%) |
91 |
91 |
91 |
90 |
90 |
||||
|
Chemical plant availability (%) |
89 |
93 |
92 |
90 |
85 |
||||
|
Cash capital expenditure ($ million) |
8,926 |
7,408 |
6,090 |
5,925 |
5,117 |
||||
|
Capital employed ($ million) |
70,859 |
56,633 |
56,431 |
52,672 |
46,280 |
||||
|
Employees (thousands) [A] |
36[A] |
39[A][B] |
42[A][B] |
46[A] |
43 |
||||
|
|||||||||
Downstream CCS earnings and ROACE [A]
$ billion
%

[A] Earnings and ROACE on CCS basis excluding identified items.
Downstream cash capital expenditure
$ billion