[...] million) 4,744 6,775 3,091 (2,704) (2,255) Cash flow from operating activities ($ million) 19,528 22,661 16,337 7,662 5,453 Liquids production (thousand b/d) 1,720 1,589 1,622 1,615 1,305 Natural gas production (million scf/d) 5,935 6,494 6,699 6,781 5,911 Total production (thousand boe/d) 2,743 [...]
[...] creating a sustainable foundation of cash flow and complementing conventional and deep-water investments. We strive for our shales operations to be safe and efficient. We expect to deliver between $2 billion and $3 billion in organic free cash flow per year by 2025 at $60 per barrel (real terms [...]
[...] per ADS ($) 3.94 5.64 3.16 1.16 0.62 Cash flow from operating activities 42,179 53,085 35,650 20,615 29,810 Dividend per share ($) 1.88 1.88 1.88 1.88 1.88 Dividend per ADS ($) 3.76 3.76 3.76 3.76 3.76 Attributable to shareholders. Dividend declared in respect of the relevant quarter. CCS earnings [...]
[...] for heavy-duty vehicles and marine vessels. Cash flow from operations $15.3 billion Production 922 kboe/d LNG liquefaction volumes 35.6 million tonnes LNG liquefaction plants 13 in operation LNG cargoes 3 sold every day Power managed 10,000 MW traded in 20+ countries Power generation capacity [...]
[...] cash generation through the coming decades. Cash flow from operations $19.5 billion Production 2,743kboe/d Cash capital expenditure $10.3 billion New acres ~9 million net undeveloped acres addition GHG emissions 1.9 million tonnes lower vs. 2018, direct GHG emissions (scope 1) FIDs taken >7
[...] petrochemicals for industrial use worldwide. Cash flow from operations $7.3 billion Availability 91% weighted average for refineries and chemical plants Retail sites 45,000 Shell-branded retail sites, serving more than 30 million customers daily Barrels of crude traded 10 million per day [...]
[...] ($ million) 6,680 7,567 9,082 7,243 9,748 Cash flow from operating activities ($ million) 7,296 13,928 12,429 3,556 14,076 Oil Products sales volumes (thousand b/d) 6,561 6,783 6,599 6,483 6,432 Chemicals sales volumes (thousand tonnes) 15,223 17,644 18,239 17,292 17,148 Refinery processing intake [...]
[...] ROACE of more than 15% and organic free cash flow of between $8 billion and $9 billion per year by 2025 at $60 per barrel (real terms 2016) and mid-cycle Downstream conditions. Shell retail site Inside Oil Products Refining and Trading Marketing
[...] $2 billion and $3 billion organic free cash flow per year by 2025 at $60 per barrel (real terms 2016) and mid-cycle Downstream conditions, representing a ROACE of around 15%. Geismar Chemical Plant, Louisiana, USA
Policy Our policy is to grow the US dollar dividend through time in line with our view of Shell’s underlying earnings and cash flow. When setting the dividend, the Board of Directors looks at a range of factors, including the macroeconomic environment, the current balance sheet and future [...]
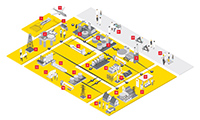 Our businesses and organisation
 Overall highlights in 2019
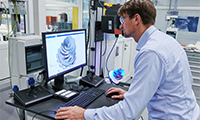 Projects & Technology overview
 Financial data